







Predictive Analytics in Retail: From Sales Data to Decisions That Hold Up
Updated September 15, 2026

 Summarize in ChatGPT
 Summarize in ChatGPT
Nearly everything your retail demand model needs already exists in your core systems. Your POS tracks every transaction, your inventory platform records what went unsold, and your CRM knows who keeps coming back. Yet for most retailers, these systems operate in isolation because their data never meets in one place, meaning planning ultimately defaults to whichever single feed a spreadsheet can reach.
Predictive analytics in retail starts by joining your systems. Once historical data comes together, the model forecasts demand down to the individual product and store level. That precision translates directly into clear financial results: fewer empty shelves on high-demand items, earlier markdowns that preserve profit margins, and freed-up working capital from slow-moving inventory.
What follows is organized around decisions: which use cases deliver ROI first, what data sources models need, why retail analytics projects stall at the data layer, and how much time a first project requires. Retail executives, merchandising leads, supply chain teams, and e-commerce managers each own one of them.
Content
Retail predictive analytics applies statistical algorithms and machine learning to historical data to estimate what happens next. Predictive analytics returns a probability: this SKU sells 340 units next week, give or take 40, and here are the variables driving it.
Merchandising, marketing, and supply chain teams can share one data analytics stack, which lets predictive analytics in retail scale across departments. Understanding how predictive analytics works alongside your existing reporting keeps expectations grounded from the start.
Most retail companies already rely on descriptive analytics. Dashboards clearly show what happened last quarter and which categories carried margin, but those insights look entirely backward.
Predictive analysis extends the same data forward. Regression analysis, time-series predictive models, and classification algorithms find patterns in existing data and project them onto future conditions. Prescriptive analytics in retail recommends the action: raise the order to 400 units and accept the small carrying cost, because an empty shelf in this category is expensive.
If merchants don’t trust the underlying forecast, they will simply ignore prescriptive analytics recommendations.
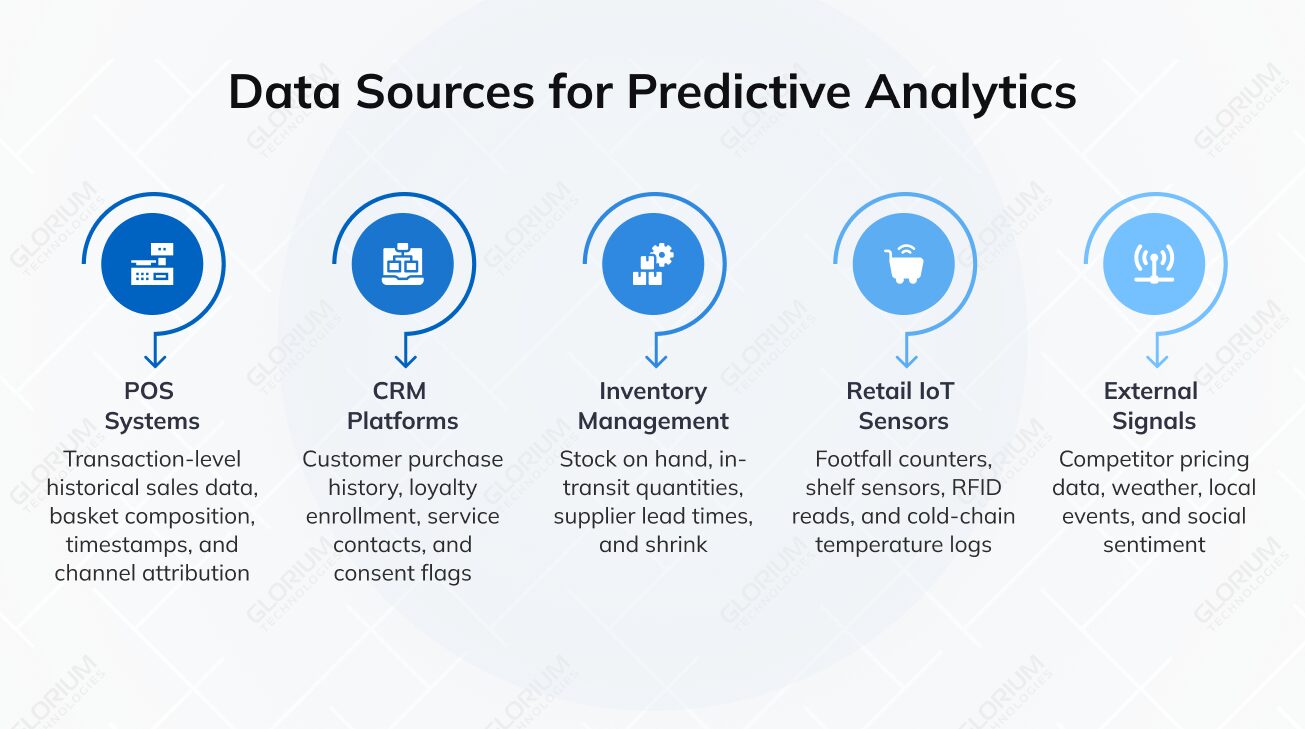
Predictive analytics models are only as good as their inputs. A realistic data collection layer for retail predictive analytics pulls from five places:
Predictive analytics built on POS data alonecan forecast demand, but it completely misses customer behavior because sales feeds can’t tell you why someone walked out empty-handed. Data collection is the unglamorous half of predictive analytics in retail, and naming your data sources honestly is where it starts.
Traditional forecasting relies on fixed statistical rules like moving averages or exponential smoothing, weighting the model heavily toward recent sales. Machine learning models update as new data arrives and hold dozens of variables at once: weather, competitor price, local events, and cannibalization between similar SKUs. That makes predictive analytics useful when consumer behavior shifts inside a planning cycle, and customer behavior changes weekly in some categories.
The tradeoff is maintenance. Predictive models trained on 2024 buying patterns drift as customer preferences change, which shows up first as rising forecast error on new products. Most retail teams retrain quarterly and monitor weekly, so retail predictive analytics work includes that schedule from day one.
Retail businesses that see value early pick one decision and improve it. Platform purchases come later, once that first decision shows a measurable result. The five retail analytics use cases below offer the clearest line from a prediction to a measurable P&L impact.
Demand forecasting predicts how much of each product sells, where, and when. Predictive analytics combines historical sales data with promotional calendars, seasonal trends, and pricing data to forecast customer demand at SKU and store level.
McKinsey’s operations research, still the most cited benchmark in the field, reports error reductions of 20% to 50% against traditional methods, with lost sales and product unavailability falling by as much as 65%. The range carries the real information: a grocery chain with clean scan data lands near the top of it, and a specialty retailer with patchy records lands near the bottom.
The practical gain from predictive analytics is planning confidence. Accurate forecasts of customer demand let a buyer commit to a larger order on a fast mover and pull back on a seasonal risk.
“Retail moved too fast for the old forecasting playbook. Demand curves built on years of history assume preferences drift slowly, and they don’t anymore — they turn overnight. Predictive models can weigh promotions, weather, omnichannel signals, and social movement all at once, which means volatility becomes something you trade on instead of something that catches you flat.”
Ashley Hetrick, Principal and Supply Chain Practice Leader, The Predictive Edge
Demand forecasting says what will sell. Inventory management optimization decides what to hold. Predictive analytics sets reorder points, safety stock, and allocation across physical stores and fulfillment centers using POS and IoT data, replacing a fixed weeks-of-supply rule.
Predictive analytics in retail delivers two results here. Optimized inventory management frees working capital because less cash sits in slow-moving stock. Fewer emergency transfers, less expedited freight, and lower storage costs improve operational efficiency across retail operations.
Automated replenishment closes the loop: when forecast and stock position live in the same inventory management system, orders go out on schedule without a planner rebuilding a spreadsheet.
None of this runs on fragmented stock records, so the groundwork comes first. A UAE retail group with three physical stores and an online shop had inventory living in separate systems, so no forecast could see the full position. Glorium Technologies built an Odoo POS integration that unified stock across every channel and cut stockouts and overstocking by 80% on data unification alone. That connected layer is the precondition for predictive analytics in retail, turning inventory management into a rolling decision.
Dynamic pricing adjusts prices in response to future demand, competitor moves, inventory levels, and margin targets. Amazon is the standard industry example, repricing millions of products many times a day.
Most retail businesses do not need that cadence. Weekly repricing on a few hundred competitive SKUs, with predictive analytics reading competitor pricing data alongside your own sell-through, captures most of the available margin without unsettling shoppers.
Pricing strategies built on predictive analytics also improve markdown timing. A 20% markdown in week six clears the same stock that needs 50% by week twelve, and predictive analytics spots that trajectory early. These pricing strategies let you optimize pricing at SKU level, where most recovered margin sits.
Predictive analytics reads purchase history and on-site customer behavior to flag shoppers whose engagement is fading. Falling order frequency, a shrinking basket, or a service complaint each carries a signal, and a classification model weighs them together.
Glorium Technologies built this for Acadian Group, a US commercial real estate operator. The churn prediction system runs a Python and scikit-learn pipeline that scores churn probability and explains which factors drive it, so the client targets retention offers at the accounts most likely to leave. The mechanics transfer directly to retail predictive analytics: the same model family, trained on baskets and browsing sessions.
Proactive retention is the cheaper path. Reaching an at-risk customer while they are still buying lifts customer engagement and customer loyalty.
Predictive analytics ranks the next likely purchase for each shopper by analyzing customer data: purchase history, browsing sessions, and behavior across similar customer segments. Market basket analysis sits alongside it, identifying products frequently bought together so teams can build bundles around real buying patterns.
Customer segmentation works the same way, grouping shoppers by behavior and customer preferences. Predictive analytics then routes marketing campaigns toward people actually in the market, the foundation of personalized customer service and effective marketing strategies at scale. Budget waste drops because the model also tells you who not to contact, and those marketing strategies port across email, paid, and on-site.
McKinsey’s personalization research puts the payoff at a 5% to 15% revenue lift and 10% to 30% better marketing ROI, with acquisition costs falling by as much as half. Merchandising reads those numbers as customer engagement; finance reads them as cheaper growth and a durable competitive advantage.
| Use case | Typical model | Minimum data history | Metric it moves |
| Demand forecasting | Time-series, gradient boosting | 2 to 3 years, SKU level | Forecast error, lost sales |
| Inventory optimization | Optimization on forecast input | 12 to 18 months, plus lead times | Stock turns, working capital |
| Dynamic pricing | Elasticity and regression models | 6 to 12 months, plus a competitor feed | Gross margin, markdown rate |
| Churn prediction | Classification with explainability | 18 to 24 months of customer records | Retention rate, CLV |
| Personalized recommendations | Collaborative and content-based filtering | 6 months of session and order data | Conversion, average order value |
Executives approving budget want a number. Predictive analytics solutions touch three lines on the P&L: revenue, working capital, and the return on marketing campaigns. Each needs a baseline captured before the pilot, because payback is unprovable afterward without one.
Pull five numbers: stockout rate on top SKUs, conversion on personalized merchandising, markdown depth by category, days of inventory on hand as a direct read on inventory management, and the ratio of expedited to planned freight. Predictive analytics lets you optimize pricing where shoppers are least price-sensitive, and claiming that margin later requires knowing today’s markdown curve.
The arithmetic runs on a napkin. A retailer turning over $50 million and losing 4% of sales to empty shelves leaves $2 million unclaimed, so recovering a quarter of it funds the program. Marketing campaigns tuned on the same data analysis lift conversion without extra spend, and replacing opinion-led planning with data-driven decisions anyone can audit is what makes the figure defensible to finance.
Leaner inventory levels free cash, tighter inventory management shortens the gap between paying a supplier and selling the goods, and supply chain optimization built on accurate forecasts smooths labor planning. Supply chain efficiency improves on the vendor side as well. Accurate demand forecasts give suppliers the lead time they need to plan production effectively, giving you the leverage to negotiate better terms and lower costs.
Frictionless shopping depends on product availability above all. Customers who face an empty shelf try a competitor once and often stay there, so stockouts erode customer experience and customer satisfaction together. Fixing availability is a cheap way to improve customer satisfaction in the retail industry.
Deloitte’s 2026 Retail Industry Outlook, a survey of 330 retail executives, found 67% expect AI-driven personalization within a year and 68% expect agentic AI across operations within 12 to 24 months. Three in ten already use AI for supply chain visibility, rising to an expected 41% within a year.
Predictive analytics in retail has moved from competitive advantage to baseline expectation at that pace, which raises what shoppers treat as normal customer experience.
It’s worth addressing failure head-on: most retail analytics projects stall for reasons that have nothing to do with the math.
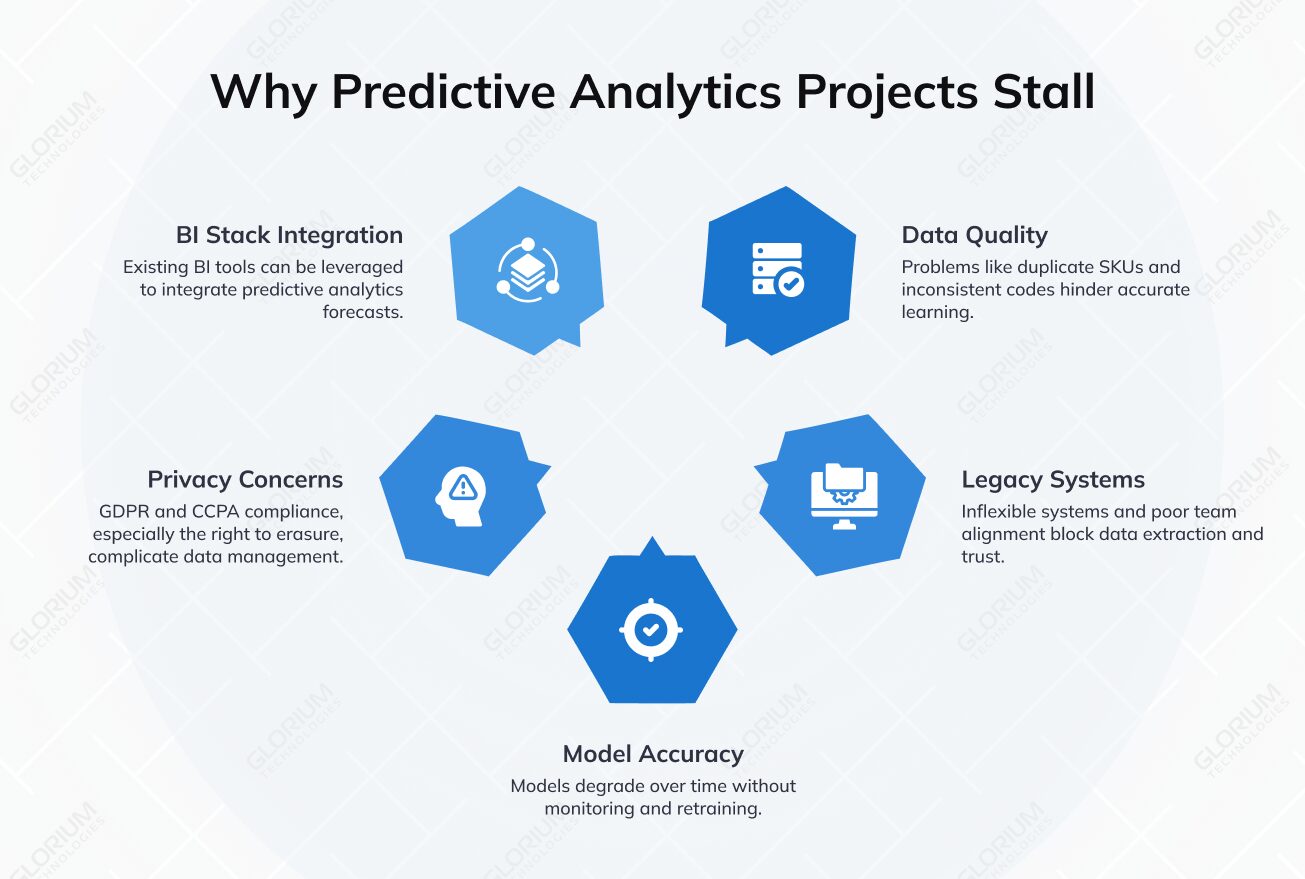
Data quality problems surface the moment predictive analytics tries to learn from data collected across systems never designed to talk to each other. The usual culprits are mundane:
Data integration routinely takes longer than model development. Budget for it up front.
Inflexible legacy systems block the data extraction that any predictive analytics project depends on, and weak alignment between IT and merchandising compounds it. Analysts build predictive analytics models without the context merchants need to trust them, and the familiar spreadsheet wins by default. Bringing the people who act on the forecast into the design conversation early solves much of this.
Predictive analytics models validated in March degrade by September as buying patterns move. Without monitoring, accuracy erodes quietly, and confidence goes with it. Retail predictive analytics needs a named owner, a retraining cadence, and a published accuracy metric everyone can see.
Privacy and data management
Analyzing customer data brings GDPR, CCPA, and consent obligations, and the sharpest conflict is the right to erasure. A record deleted from your CRM keeps its influence on a model already trained on it, so retention rules and predictive analytics retraining cycles have to be designed together. Loyalty programs are where the exposure usually sits. Data management needs retention limits, access controls, and a documented path for deletion requests.
Most retail companies already run Power BI, Tableau, or Qlik Sense for data analytics, and those tools do their job well. Predictive analytics tools connect to that reporting layer and extend it. Custom predictive analytics solutions push forecasts into the dashboards your teams already open every morning, which is the fastest route to adoption.
A first predictive analytics project should be small enough to finish and specific enough to measure. Three principles keep it on track.
Aim at a decision someone makes on a schedule, and let the broader retail analytics goals follow from it: how much of a category to order, which customers get the retention offer, when to mark down seasonal stock. One decision gives you a baseline, a target, and an owner.
Check three things before scoping anything, ideally with your data analytics team in the room:
No data analysis fixes records that were never captured, which is why this audit comes before the budget conversation.
Run predictive analytics in parallel with the current process for one planning cycle and compare forecast accuracy on the same SKUs. Predictive analytics cost is easier to justify when the pilot produces a measured delta, and the data-driven insights usually reshape the retail analytics roadmap.
Most retail companies arrive at the same point: the use cases are clear, the budget conversation has started, and the blocker is turning fragmented data into predictive models anyone will trust. An honest answer on whether your data can carry a model takes about a week of looking at real tables, and it saves months of building against a wrong assumption.
Glorium Technologies has built data-driven software since 2010, with dedicated practices in AI software development, custom AI agent development, and data science consulting. Our teams consolidate fragmented data, build predictive analytics models that explain their own output, and wire forecasts into the systems merchants already open every morning. We work as a scoped project with fixed deliverables or as a dedicated team alongside your analysts, whether the target is demand forecasting, pricing, or marketing campaigns.
Contact our team about where predictive analytics fits your roadmap, and we can scope a pilot against your own data.
A scoped predictive analytics pilot on one category typically runs 8 to 14 weeks; half of it is data preparation. Retailers with clean, centralized data land at the short end; those pulling from four disconnected systems land past it. Glorium Technologies runs a short discovery first so the timeline is known before the build starts.
Yes, with narrower scope. Smaller retail businesses gain most from replenishment forecasting on their top 100 SKUs, where volume is high enough to learn from. Historical sales data still matters: under a year, seasonal output stays unreliable. Store placement optimization and full dynamic pricing need scale most independents lack, which is why Glorium Technologies typically begins with a single module.
A business owner paired with a technical one. Predictive analytics that lives entirely inside IT gets treated as a black box and bypassed, while a merchandising lead who reviews accuracy monthly and can explain a forecast to peers keeps it in daily use. Glorium Technologies hands over documentation and retraining runbooks so the client team can own the model outright.
Track forecast error against actuals every cycle and set a threshold, for example, 15% relative degradation from the validated baseline. Retrain after structural changes too: a new store format, a major assortment shift, or a channel launch. Glorium Technologies builds that monitoring into the pipeline so the check runs automatically.
No. Predictive analytics is strong on volume and pattern recognition. Anything without historical precedent, such as a brand-new product line, stays a judgment call. The pattern that holds up is predictive analytics producing the baseline forecast and a merchant adjusting it with reasoning that gets recorded and fed back in, so data-driven decisions and category expertise reinforce each other, which is where most of the retail industry is landing.