







Predictive Analytics Tools: How to Choose and Implement the Right One
Updated September 17, 2026

 Summarize in ChatGPT
 Summarize in ChatGPT
Most companies aren’t short of data anymore. You’ve probably got years of transactions in the warehouse, a CRM full of account history, and maybe a BI dashboard someone checks every Monday. And yet the decisions that matter still get made on last quarter’s numbers, since none of those systems were built to say what happens next.
Standard reporting is great for tracking past performance, but predictive analytics allows you to anticipate future trends. They read historical data with machine learning algorithms and statistical modeling, then return a probability attached to something specific: this account will churn, this machine will fail, this invoice will go unpaid.
The catch is that search results for predictive analytics tools target totally different buyers. Decades-old statistical packages appear alongside cloud services that train models on billions of records, and a statistician at a bank will pick a platform the ML engineer at a logistics firm would reject. Below, we’ll break these down into three tiers, highlight the core techniques behind them, and spell out what separates a tool that delivers real value from expensive shelfware.
Content
A predictive analytics platform learns from labeled history, scores new records against what it learned, then updates itself as new data arrives. All of it exists to forecast future outcomes early enough to act on them.
Descriptive analytics answers what already happened: revenue by region last quarter, tickets closed last month, units shipped last week. Predictive analysis moves the same historical data forward and estimates what comes next.
The difference shows up in the workflow. A BI dashboard tells a sales director that renewals dropped. A predictive analytics platform scores every account by churn probability and ranks which ones to call on Monday. That shift turns raw data analytics into actionable insights and supports data-driven decisions rather than after-the-fact commentary.
Every predictive analytics framework runs the same sequence, whatever the vendor calls it:
Skip the fifth step and performance decays quietly. Predictive models trained on last year’s customer behavior data drift as pricing and buying habits change. Advanced analytics platforms automate the mechanical parts of this loop, feature engineering and retraining triggers among them. Deciding which future outcomes are worth predicting stays a business call.
Vendors describe their products as AI-powered prediction engines, which hides the part buyers need to evaluate. Underneath that phrasing, statistical modeling applies regression analysis, decision trees, and neural networks to identify hidden patterns in data. Naming the common predictive analytics techniques shows what a platform can and cannot model.
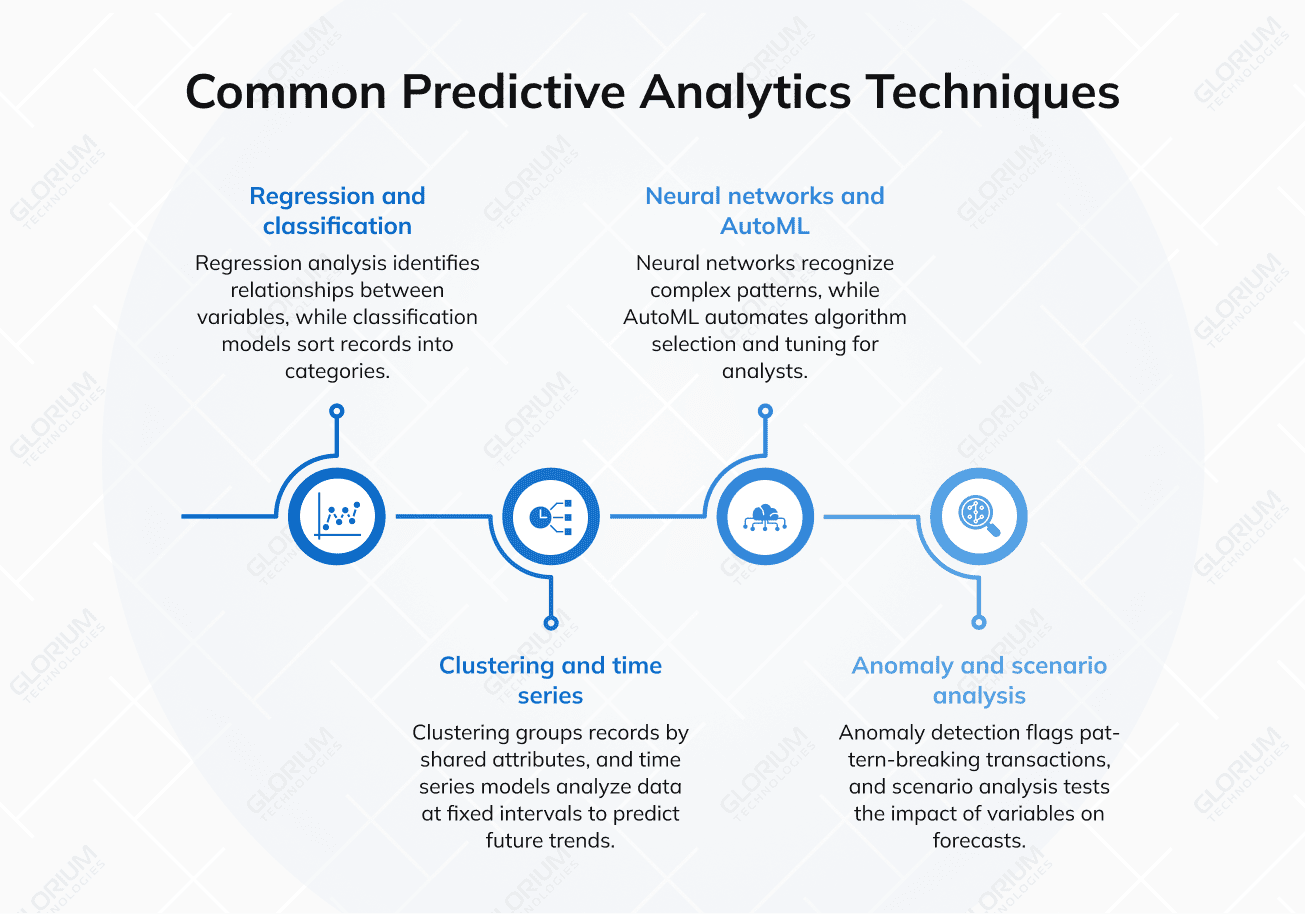
Regression pinpoints relationships between variables to project continuous values, like next quarter’s revenue. Classification sorts data into distinct categories, predicting whether a customer will churn, a transaction is fraudulent, or a borrower is high-risk. Logistic regression focuses purely on classification, while decision trees and random forests can handle both. Random forests aggregate hundreds of decision trees to boost accuracy, though they are harder to interpret than simple models.
Clustering models group records by shared attributes without being told the answer in advance. Marketing teams use them to identify patterns in customer behavior and surface segments nobody defines by hand.
Time series models analyze data at fixed intervals, separating trend, seasonality, and noise, so teams can predict future trends with a defensible margin of error. Anything with a calendar attached leans on them: sales forecasts, staffing plans, energy load, inventory. Most predictive analytics software now generates automated forecasts with seasonality detection built in.
Neural networks mimic the layered structure of the brain to recognize patterns too complex for linear methods, which is why they underpin image, text, and behavioral predictive models. AutoML automates algorithm selection and tuning, letting an analyst produce a working model without writing training code. Anomaly detection flags transactions or sensor readings that break the pattern, the backbone of real-time fraud detection. Analysts also perform scenario analysis, asking what a 5% price increase does to a churn forecast.
A flat list of the best predictive analytics software misleads more than it helps. The market splits into three tiers, and the right one becomes clear once you look at who will operate the tool day to day.
IBM SPSS Modeler, Minitab, and SAS Viya grew out of academic statistical modeling. Analysts load historical data, run visual model building on a drag-and-drop canvas, and produce output that regulators already accept. Trade-offs show up in cloud deployment and in data arriving continuously, not in batches.
Dataiku, Alteryx, H2O Driverless AI, and Altair AI Studio (formerly RapidMiner) target mixed teams. Analysts work in a visual analytics interface, data scientists drop into Python or R on the same project, and governance covers both. Each is a shared data science platform combining data prep, modeling, and deployment, which suits organizations with real analytics capabilities and no appetite for infrastructure work.
SAP Analytics Cloud belongs in the same conversation for companies standardized on SAP. The product folds business intelligence, planning, and predictive analytics capabilities into one environment, so forecasts feed straight into budgets.
Azure Machine Learning, Google Cloud Vertex AI, Amazon SageMaker AI, and Databricks give data engineers full control over pipelines, training, and serving. They win on scale and advanced analytics flexibility. They also demand the most expertise, since you assemble the workflow rather than receive it.
Google Cloud BigQuery ML takes a shorter route through the same tier. Predictive models train in SQL inside the warehouse, so prepared data never leaves it, which fits teams with strong SQL and no ML engineering bench.
“Businesses using BigQuery can scale seamlessly to store and analyze petabytes of data without purchasing more storage capacity. The advantages of BigQuery are the pay-as-you-go model and the ability to focus on analyzing terabytes of data to derive meaningful insights without the need for a database administrator.”
Top Predictive Analytics Tools, TechnologyAdvice
| Tier | Representative tools | Typical pricing model | Time to a first production model |
| Legacy statistical tools | IBM SPSS Modeler, Minitab, SAS Viya | Named-user or perpetual license | Weeks, after data prep |
| Collaborative machine learning platforms | Dataiku, Alteryx, H2O Driverless AI, SAP Analytics Cloud | Annual per-seat subscription | Weeks to a few months |
| Cloud-native machine learning platforms | Azure Machine Learning, Google Cloud Vertex AI, BigQuery ML, Amazon SageMaker AI, Databricks | Consumption-based | Months, including pipeline work |
Across all three tiers, the underlying predictive analytics algorithms overlap; differences concentrate in workflow, governance, and automation.
Every vendor demo looks convincing because every demo runs on clean data. Ranking the best predictive analytics tools gets easier when you score them against your own constraints.
An organization whose analysts live in Excel and Power BI will stall on a cloud-native machine learning platform. A team with six data scientists outgrows a legacy statistical package within a quarter. Match the tool to the stage you occupy, with headroom for the next one.
Ask how the vendor reports accuracy. Raw accuracy percentages mislead on imbalanced problems, where fraud might be one transaction in ten thousand. Precision, recall, and the F1 score describe model accuracy better, and they show whether accurate predictions land where the money is.
Explainability carries equal weight. Lenders, insurers, and healthcare providers must justify a prediction to a regulator, so treat feature attribution, model lineage tracking, and audit trails as required predictive analytics features. Newer entrants add bias mitigation and guardrails against fabricated output, which older platforms leave to the buyer. Human-in-the-loop review belongs in the design from day one.
The right predictive analytics tool fails quietly when data integration turns into a six-month project. Four checks are worth running before you sign:
Predictive analytics tools earn their budget in a handful of recurring patterns, each converting a routine judgment call into a data-driven decision. Most start with a single use case.
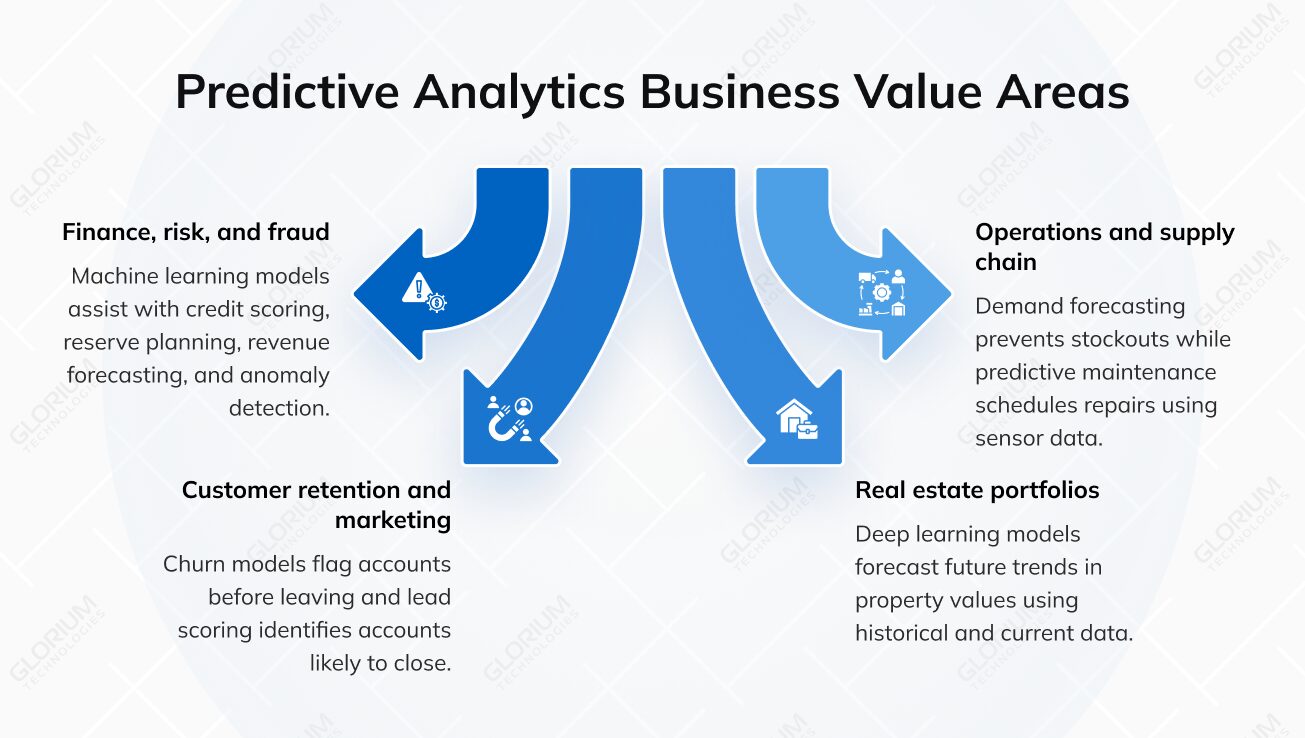
Churn models flag an account before it leaves, while there is time to intervene, and lead scoring points sales at the accounts most likely to close. Marketing teams develop marketing strategies around predicted segments rather than demographic guesswork, using customer behavior data already in the CRM.
Glorium Technologies built a tenant churn prediction system for a client managing a large portfolio of US commercial properties. The machine learning pipeline estimates the probability of tenant churn, explains which factors drive each score, and improves as it trains on more data. Explainability mattered as much as the prediction: the client needed to know which discounts and lease terms changed tenant decisions.
Banks and insurers rely on machine learning models for credit scoring, reserve planning, and revenue forecasting. Anomaly detection catches fraudulent transactions before settlement rather than after a chargeback. Risk teams apply the same predictive data analysis to vendor payments and claims, where advanced analytics surfaces irregularities that rule-based systems miss.
Demand forecasting prevents both stockouts and dead inventory, helping predictive analytics quietly improve operational efficiency across retail and distribution. Predictive maintenance reads sensor data and schedules repairs before a line goes down. In healthcare, patient risk models support earlier clinical and staffing decisions, covered in our predictive analytics in healthcare guide.
Real estate portfolios run on the same logic. Our predictive insights platform replaced manual market tracking with deep learning predictive models that read historical and current data to forecast future trends in property values, and the client reported higher efficiency and revenue.
Buying a license is the fast part; turning historical data into predictive insights that decision-makers trust is where projects stretch or stall.
Data preparation consumes the largest share of a predictive analytics project, and weak data is why predictive models never ship. Gartner found that 63% of organizations either lack the right data management practices for AI or are unsure whether they have them, and predicts that organizations will abandon 60% of AI projects unsupported by AI-ready data through 2026.
Volume matters too. As a rule of thumb, supervised problems need several hundred labeled examples of the target event, plus enough historical data to cover a full business cycle. Six months of thin sample data will not teach a model what December looks like, and synthetic augmentation narrows that gap without ever closing it.
Model accuracy degrades as behavior shifts, so drift monitoring belongs in the launch plan, with a named owner and a threshold that triggers a rebuild. Deploy predictive models inside the CRM or planning tool, since a separate portal nobody opens produces nothing.
Staffing follows the same logic. Data engineers build the pipelines, data scientists own model design and validation, and domain experts decide which predictions are worth acting on. Companies without that mix bring in data science consulting or add dedicated developers.
The mechanics of predictive analytics hold across every use case above, but the details rarely transfer cleanly between sectors. A commercial tenant churn model works nothing like a distribution demand forecast, and credit scoring answers to regulatory rules a maintenance model never faces. That divide is exactly why the team building your solution matters just as much as the tech platform behind it.
Glorium Technologies has spent years building machine learning solutions for companies in healthcare, real estate, fintech, and manufacturing. Whether you’re deciding which prediction model to prioritize or mapping out how to integrate it with your current tech stack, working with a team that has already crossed the finish line gets you to a proven solution much faster than starting from scratch.
If you are ready for that step, book an intro call with Glorium Technologies.
Per-seat platforms commonly run from a few hundred to several thousand dollars per user annually, while cloud-native services bill on compute and storage. Licensing is the smaller line item, since integration, preparation, and operating time account for most of the first-year cost. Glorium Technologies prices those during discovery, so clients see total cost of ownership before signing.
Yes, within limits. Simple regression and classification problems produce usable results from a few hundred labeled examples when the data is clean, and the signal is strong. Rare-event modeling such as fraud detection needs many more positive cases before the model learns anything reliable. Where historical data is thin, Glorium Technologies narrows the scope to one high-value prediction and widens it as records build.
Migration is realistic but rarely trivial. Predictive models saved in open formats such as ONNX or PMML, or written in plain Python, port with modest effort. Anything built inside a vendor’s proprietary visual builder needs rebuilding, so our engineers redo those in portable code first. Ask about export formats during procurement, and you save that work later.
AutoML narrows the skills gap and lets analysts build credible predictive models without writing code. Someone still has to frame the business question, judge whether training data represents reality, and catch a model that has gone stale. Automation changes team composition more than it changes the need for one, and companies that would rather not spend a quarter hiring extend their bench through Glorium Technologies.
Tie the model to a decision and measure the decision. If the goal is retention, track saved accounts against a control group rather than F1 scores reported to the board. Glorium Technologies sets that baseline during discovery, because a number nobody recorded proves nothing later.