







Healthcare Business Intelligence: Turning Clinical and Financial Data into Better Patient Care
Updated October 9, 2026

 Summarize in ChatGPT
 Summarize in ChatGPT
Healthcare providers across the industry run on data spread across separate systems. Admissions and medical records are in the EHR, bed counts in a spreadsheet, denied claims in the billing platform, and supply alerts in someone’s inbox. Each source holds a narrow slice of healthcare data, while healthcare professionals and leaders need the combined picture to plan staffing, budgets, and quality patient care.
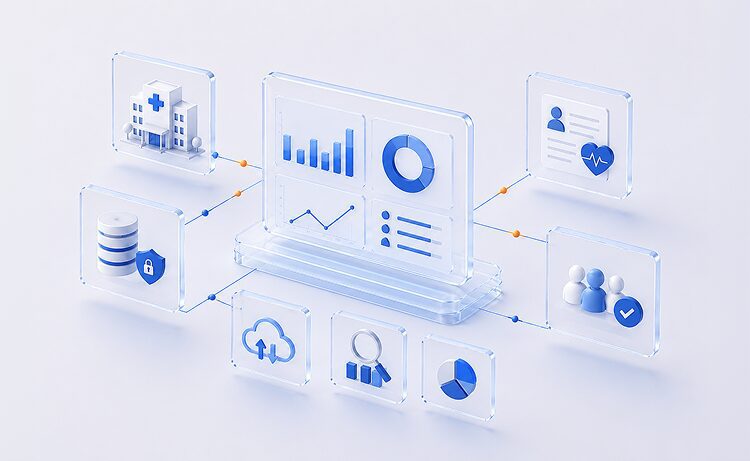
Healthcare business intelligence provides that picture. A business intelligence system pulls clinical, financial, and operational data into one model, helps teams analyze data without manual exports, and turns the results into dashboards staff can act on within minutes.
This guide gives you a working picture of a healthcare BI platform before you talk to vendors: what it connects to, what it costs to build, and where most rollouts need extra planning.
Content
Business intelligence in healthcare is the set of methods, business intelligence software, and data pipelines that transform data from raw records into decisions. The raw material spans electronic health records, lab results, claims, staffing rosters, supply orders, readings from medical devices, and data from clinical trials. Healthcare business intelligence solutions clean that patient data, connect the pieces, and show the results in reports that clinicians and managers read without writing code.
Most healthcare organizations group their clinical and administrative data into three BI domains:
The value appears when these domains meet. A readmission dashboard becomes far more useful once it also shows the cost of each return visit and the discharge unit that sent the patient home. That link between clinical and financial data separates a business intelligence system from the standard reports inside an EHR, and it explains why BI now sits at the center of running a healthcare business.
Predictive models are inside this stack as well now. The federal ASTP/ONC data brief on predictive AI reports that 71% of U.S. hospitals used predictive AI integrated with their EHR in 2024, up from 66% in 2023. BI is the layer where many of those risk scores become visible to the people who act on them.
From the user’s side, a healthcare BI solution looks simple. A nurse manager picks a unit and a date range, and a dashboard appears. Behind that screen, four layers do the heavy lifting, and each one needs its own design decisions.

Integration tools collect data from source systems, then transform and load it into a central store. In healthcare, that usually means two kinds of tooling working together. Interface engines such as NextGen Connect (formerly Mirth Connect) or Rhapsody receive HL7 v2 messages and FHIR resources from the EHR, lab, and billing systems. Cloud pipeline services such as Azure Data Factory or AWS Glue then schedule the loads and run the transformations. Transformation covers mapping codes such as ICD-10 and LOINC, converting units, removing duplicate patients, and flagging missing values. Getting this layer right determines whether every later report can be trusted.
An enterprise data warehouse keeps cleaned, structured history in one place. Common choices include Microsoft Fabric, Amazon Redshift, and Snowflake. Microsoft Fabric now absorbs much of what Azure Synapse Analytics used to handle. Many providers pair the warehouse with a cloud data lake for unstructured data such as clinical notes and imaging metadata. For FHIR-native storage, managed services such as Azure Health Data Services or AWS HealthLake hold clinical records in standard FHIR format before they reach the warehouse.
Health systems that plan to run research or cross-organization analysis often organize the warehouse around the OMOP Common Data Model, an open standard maintained by the OHDSI community. It gives every source the same table structure and vocabulary. The warehouse is also where data management rules live: retention periods, role-based access, and audit trails for regulatory compliance.
This layer applies statistical methods and machine learning to find patterns people would miss in a spreadsheet. Most healthcare teams build these models in Python, using libraries such as scikit-learn for risk scoring and PyTorch for deep learning on imaging or signal data. Typical outputs include readmission risk scores, no-show predictions, and cost outliers by service line. For population-level work, the FHIR Bulk Data Access standard lets the pipeline export records for an entire patient cohort in one request instead of querying patients one at a time.
The final layer presents results as interactive dashboards, scheduled reports, and alerts. Tools such as Microsoft Power BI and Tableau let a user drill from a hospital-wide figure down to one unit, one physician, or one patient cohort. Reporting tools also push alerts when a metric crosses a threshold, so staff don’t have to go looking.
Healthcare analytics, like business analytics in other sectors, usually matures in four steps. Each step answers a harder question and needs cleaner data than the one before. The table below pairs every type with a concrete scenario a hospital team would recognize.
| Type | Question it answers | Healthcare example |
| Descriptive | What happened? | Emergency department wait times by hour for the last 90 days |
| Diagnostic | Why did it happen? | Tracing a spike in claim denials to one missing prior-authorization step |
| Predictive | What is likely to happen? | Flagging high-risk patients for 30-day readmission at discharge |
| Prescriptive | What should we do? | Recommending follow-up calls or remote patient monitoring for the top-risk group |
Most healthcare providers already run descriptive reports. Moving to predictive analytics depends less on software and more on data quality: a model trained on incomplete discharge records will misjudge patient risk. Healthcare providers that adopt predictive analytics usually start with readmissions. For a deeper look at that stage, see our guide to predictive analytics in healthcare.
A BI tool is only as complete as the sources behind it. Before choosing business intelligence tools, map every system that holds patient data or operational data, including research databases from clinical trials, then confirm how each one exposes it: HL7 v2 feeds, FHIR APIs, database replicas, or flat-file exports.
Interoperability has improved, yet gaps remain. According to the ONC data brief on hospital interoperability, 70% of U.S. hospitals at least sometimes engaged in all four domains of exchange (send, receive, find, and integrate) in 2023, while only 43% did so routinely. That shortfall is why integration work often takes more of a BI budget than the licenses do. Our overview of healthcare software development covers how custom connectors bridge EHRs, wearables, and billing platforms.
The payoff from business intelligence in healthcare shows up in three places at once: the bedside, the budget, and the boardroom. The benefits below are the ones healthcare organizations usually measure first after go-live.
When clinical data from the EHR, labs, and monitoring devices are in one view, care teams spot deterioration sooner. A dashboard built with business intelligence tools and a machine learning model can combine lab trends, missed appointments, and medication refills to flag a heart failure patient days before an emergency visit. Improving patient outcomes this way depends on alerts reaching the right clinician during the shift, so patient care changes while it still matters.
BI lets care managers segment thousands of patients by diagnosis, risk score, and social factors. Teams running chronic disease management programs use these cohorts to identify trends, such as rising A1C levels in one zip code, and assign outreach before complications develop. The same views support value-based contracts, where payment depends on measurable patient health improvements.
Linking financial data to clinical activity shows the true cost of each service line. Finance teams can see which payers deny most often, which codes trigger rework, and where length of stay drives losses. That visibility helps reduce costs without cutting services patients rely on.
Real-time occupancy, admission forecasts, and staffing data help managers plan beds and shifts hours ahead. Better resource allocation shortens boarding times in the emergency department, cuts overtime, and improves resource utilization across operating rooms and imaging.
Quality programs require providers to submit measures on readmissions, infections, and patient safety. A BI system automates much of that extraction and keeps an audit trail of how each figure was calculated. Compliance teams spend less time assembling spreadsheets and more time fixing the processes behind weak scores.
Abstract categories help with planning, but buyers usually decide after seeing a scenario close to their own. The examples below include two projects Glorium Technologies delivered and one pattern many health systems run.
ITR Software, a German healthcare software vendor, asked Glorium Technologies to rebuild the front end of its bed management platform. The team added customizable user dashboards, a scheduling calendar, and a graphical view of wards with real-time bed status. According to the patient flow and hospital beds case study, live updates replaced manual bed counting and helped management meet hospital performance targets.
Astarte Medical, a precision nutrition company, needed a web application that turns a proprietary dataset into feeding guidance for preterm infants. Glorium Technologies built the forecasting and tracking app, synchronizing feeding protocols, microbiome profiles, and clinical information into decision-tree suggestions. The Astarte Medical case study shows how analytics can move from a research dataset to a bedside tool.
Many health systems score every discharged patient for 30-day readmission risk and display the list on a care-transition dashboard. Nurses then prioritize follow-up calls, and managers compare readmission rates by unit and diagnosis over time.
Healthcare business intelligence tools fall into two groups: general-purpose platforms that you configure for clinical use, and suites built specifically for the healthcare industry with data models designed for hospitals. The right healthcare business intelligence software depends on your EHR, your in-house data team, and how much customization you need.
| Tool | Type | Best fit | Published list price |
| Microsoft Power BI | General-purpose BI | Organizations already on Microsoft 365 and Azure | Pro $14 and Premium Per User $24 per user/month |
| Tableau | General-purpose BI | Teams that prioritize advanced data visualization | Creator $75, Explorer $42, Viewer $15 per user/month, Cloud Standard |
| Qlik Sense | General-purpose BI | Associative exploration across many sources | Varies by plan; check vendor |
| Epic Cogito | EHR-native analytics | Hospitals running Epic that want built-in reporting | Part of Epic contracts |
| Health Catalyst | Healthcare-specific data platform | Health systems focused on quality and population health | Enterprise contracts |
| Custom BI solution | Built to specification | Providers with unusual data sources or product companies embedding analytics | Project-based |
License fees for business intelligence software are the visible part of the bill. With Power BI Pro at $14 per user, for example, 50 report users cost $700 per month before any integration, hosting, or dashboard development. Off-the-shelf BI tools also assume clean inputs, so many healthcare organizations pair licenses with BI services from an implementation partner that handles data engineering and data analysis.
The total cost of a healthcare BI program depends on how many sources you connect, how clean they are, and how many dashboards you need at launch. The table below shows where budgets usually go and what pushes each line up.
| Cost component | What drives it |
| Discovery and KPI definition | Number of departments, stakeholder interviews, agreement on metric definitions |
| Data integration | Count of source systems, legacy systems without APIs, HL7 and FHIR mapping |
| Data warehouse and hosting | Data volume, cloud vs. on-premises, backup and disaster recovery |
| Dashboard and report development | Number of dashboards, drill-down depth, role-based views |
| Security and compliance | HIPAA safeguards, audit logging, penetration testing |
| Licenses | User count and tier (see the tools table above) |
| Training and support | Number of user groups, ongoing report requests, model monitoring |
Timelines follow the same logic. A phased rollout typically moves through discovery, one priority use case, and then expansion to other departments. Data readiness sets the pace far more than modeling does: when source systems are accessible and reasonably clean, a focused use case can reach a validated pilot in a few months. Starting with one high-value dashboard, such as readmissions or denials, proves the model before you fund the full platform.
If your team lacks data engineers, big data services or dedicated developers can fill that gap without a long hiring cycle.
Every BI rollout meets friction, and naming it early keeps the project on schedule. The four obstacles below appear in almost every corner of the healthcare industry, along with the fix that usually works.

Duplicate patient records, free-text fields, and inconsistent codes make complex data hard to trust and slow every attempt to analyze data. Assign a data steward for each domain, set validation rules in the ETL layer, and publish a data dictionary so every team reads a metric the same way.
Older practice management and billing platforms often lack APIs. A phased integration plan starts with the systems that feed your first dashboard, then adds others through FHIR endpoints, interface engines, or scheduled extracts. Our article on digital transformation in healthcare covers modernization paths in more detail.
A central warehouse concentrates sensitive records, which raises the stakes of a breach. The IBM 2025 Cost of a Data Breach Report, summarized by HIPAA Journal, puts the average healthcare breach at $7.42 million, with 279 days needed to identify and contain it. Encrypt data at rest and in transit, apply role-based access, and log every query that touches protected health information.
Clinicians come back to dashboards that fit naturally into a busy shift. Involve end users in design sessions, embed key views inside the EHR workflow, and track usage after launch to see which views people rely on. Smaller providers often run without a dedicated analytics team, so the same person who manages billing or IT may also own reporting. For them, cloud BI tools with ready-made connectors and an outsourced data team can cover the engineering work, leaving staff free to focus on the few metrics that shape daily decisions.
Every healthcare BI project uses similar building blocks, but each one has its own data, workflows, and HIPAA requirements. That is why the team behind your platform matters as much as the software itself.
Glorium Technologies has built regulated software for the healthcare industry since 2010, including healthcare business intelligence solutions, analytics dashboards, and healthcare data platforms. Our delivery follows ISO 13485 and ISO 27001 standards and HIPAA-aligned practices, which matters when a BI platform touches protected health information. As a Microsoft Partner and AWS Select Tier Services Partner, the team works comfortably with Power BI, Azure, cloud data warehouses, and other BI tools.
Engagements match where your product or program stands today. Early-stage HealthTech founders can validate an analytics idea with an MVP. Providers and software vendors with a defined scope can hand over project-based development, as ITR Software did for its bed management dashboards. Teams that need extra capacity can add dedicated data engineers and BI developers to their own staff.
Ready to connect your clinical and financial data? Book a call with our team.
Glorium Technologies builds the integration layer that brings EHR, billing, ERP, and device data into a single healthcare BI platform. The team works with HL7 v2 feeds, FHIR APIs, database replicas, and scheduled file exports, so older systems without modern APIs can still be connected. Most engagements start with a Discovery phase that maps each source, agrees on metric definitions, and picks the first use case to launch. From there, the team builds the pipelines, data model, and dashboards incrementally, starting with the sources that feed the highest-value report.
Glorium Technologies develops analytics modules for HealthTech products that handle protected health information, following HIPAA-aligned practices and ISO 13485 and ISO 27001 standards. That includes encryption at rest and in transit, role-based access to patient data, and audit logging for every query that touches PHI. For Astarte Medical, the team built a forecasting and tracking app that turns clinical and microbiome data into feeding guidance for preterm infants inside the client’s own product. Product companies can hand over the full module as a project or add dedicated data engineers and BI developers to their existing team.
Buy when your sources are standard, and your questions match common hospital metrics. Build, or extend a platform with custom components, when you embed analytics in your own product, work with unusual data sources, or need workflows that packaged tools do not support. Glorium Technologies supports both paths, from configuring Power BI dashboards to developing custom analytics modules inside HealthTech products.
A small clinic can start with cloud BI tools connected to its practice management system and track three or four metrics that shape daily decisions, such as no-show rate, days in accounts receivable, and patient volume by provider. That scope keeps licensing costs low and gives staff useful reports within the first weeks of use. As the clinic adds locations or services, the same setup can take in billing, scheduling, and EHR data without starting over. Glorium Technologies can scope that first healthcare business intelligence dashboard in a Discovery phase, then build and extend it step by step as the clinic’s reporting needs grow.
Many BI tools now let users ask questions in plain language and receive a chart or summary. Treat these features as an assistant for exploration, and keep validated, governed metrics as the source for clinical and financial decisions. Glorium Technologies builds such AI assistants on top of governed data models, so every answer traces back to a verified figure.