







Healthcare Business Intelligence: What It Changes for Care, Margins, and Compliance
Updated September 21, 2026

 Summarize in ChatGPT
 Summarize in ChatGPT
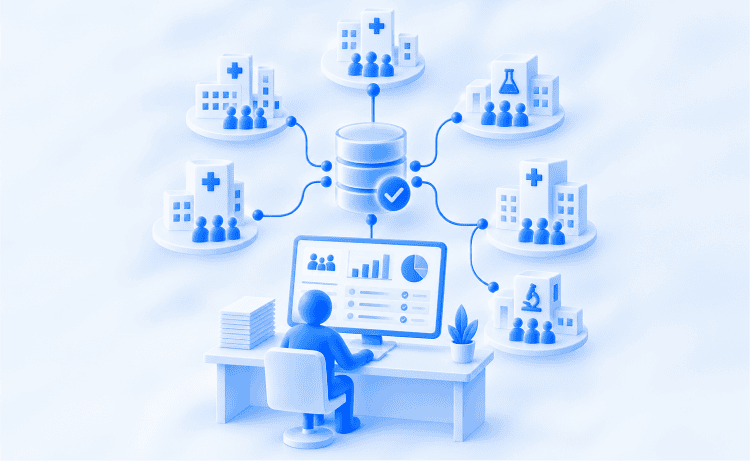
Healthcare business intelligence pulls clinical, operational, and financial data out of the systems that hold it, reconciles it into one trusted layer, and delivers it through dashboards and reports people act on the same week they see them. A working system ends the week with a staffing decision, a denial fix, or a discharge protocol that changed.
The problem it solves is familiar across the healthcare industry. Finance, quality, and population health report different figures for the same metric because each pulls from a different system on a different schedule. Healthcare professionals need one version of that data that every department accepts.
The money and the frustration both sit in the gap between holding data and acting on it, and closing that gap is a design problem before it becomes a software purchase. The decisions that determine the outcome get made early: which questions to answer first, which systems to reconcile, who settles a definition when two departments disagree. Executives, hospital administrators, IT leaders, and clinical informatics specialists each hold a piece of that, whether or not the org chart says so.
Content
Healthcare business intelligence sits between the raw systems of record and the people who make decisions. Healthcare BI tools pull from those systems, standardize what they find, and turn the result into interactive dashboards, scheduled reports, and alerts. The output has to be specific enough that a service line director can change staffing on Monday.
Most healthcare organizations already run several business intelligence tools, though none of them operate as a coordinated program. Reporting modules inside the EHR, exports into Excel, and a departmental Power BI license all count as business intelligence software. A real platform puts one reconciled source of healthcare data behind every number.
Healthcare BI tools rarely draw on one source. Data collection spans clinical, administrative, and financial systems, and typical sources include:
Integration targets extend past raw sources. Healthcare BI platforms commonly connect to hospital management software for ward and equipment use, pharmacy systems for dispensing patterns, laboratory systems for turnaround times, telehealth platforms for virtual visit economics, and medical devices streaming clinical data.
Each source speaks a different dialect. Reconciling patient identifiers, procedure codes, and department names across hospital systems decides whether anyone believes the dashboards.
Two standards carry most of that traffic, and they behave nothing alike. HL7 v2 is the messaging standard the majority of hospital interfaces still run on. A source system fires a message whenever an event occurs, an admission, a lab result, a transfer, and downstream systems parse it as it arrives. The payload is pipe-delimited text with terse segment names, and so many fields are optional that two hospitals running the same version still need custom mapping between them. Live census views and ADT-driven discharge boards almost always sit on a v2 feed.
FHIR, short for Fast Healthcare Interoperability Resources, is the newer HL7 standard and behaves like a modern web API. Clinical concepts are modeled as resources such as Patient, Encounter, Observation, and Claim, requested over HTTPS and returned as JSON. A BI pipeline can ask for exactly the fields a dashboard needs, and bulk FHIR export moves an entire population in a single job when the warehouse needs a full load.
Two federal rules turned FHIR from an option into an expectation. The ONC 21st Century Cures Act Final Rule, now administered by ASTP/ONC, requires certified health IT to expose a standardized API built on FHIR Release 4 and the US Core Implementation Guide. The CMS Interoperability and Patient Access Final Rule (CMS-9115-F) adopted those same technical standards on the payer side, requiring Medicare Advantage, Medicaid, CHIP, and federal exchange plans to serve claims and clinical data through a Patient Access API.
Both standards stay in service for years at a time. New connections go to FHIR, while the real-time event feeds already wired through the building keep running on v2, so an integration estimate that budgets for only one of them lands short.
Healthcare analytics is the broader discipline that includes statistical modeling, data mining, exploratory data analysis, and clinical research support. Healthcare BI is the operational slice of that discipline, built to answer recurring questions about performance on a fixed cadence.
A weekly dashboard showing which units are trending toward overtime belongs to BI. Most mature health systems run both, and the same underlying data warehouse feeds them.
Business analytics sits closer to finance, concerned with forecasting and scenario planning, though it draws on the same warehouse as BI.
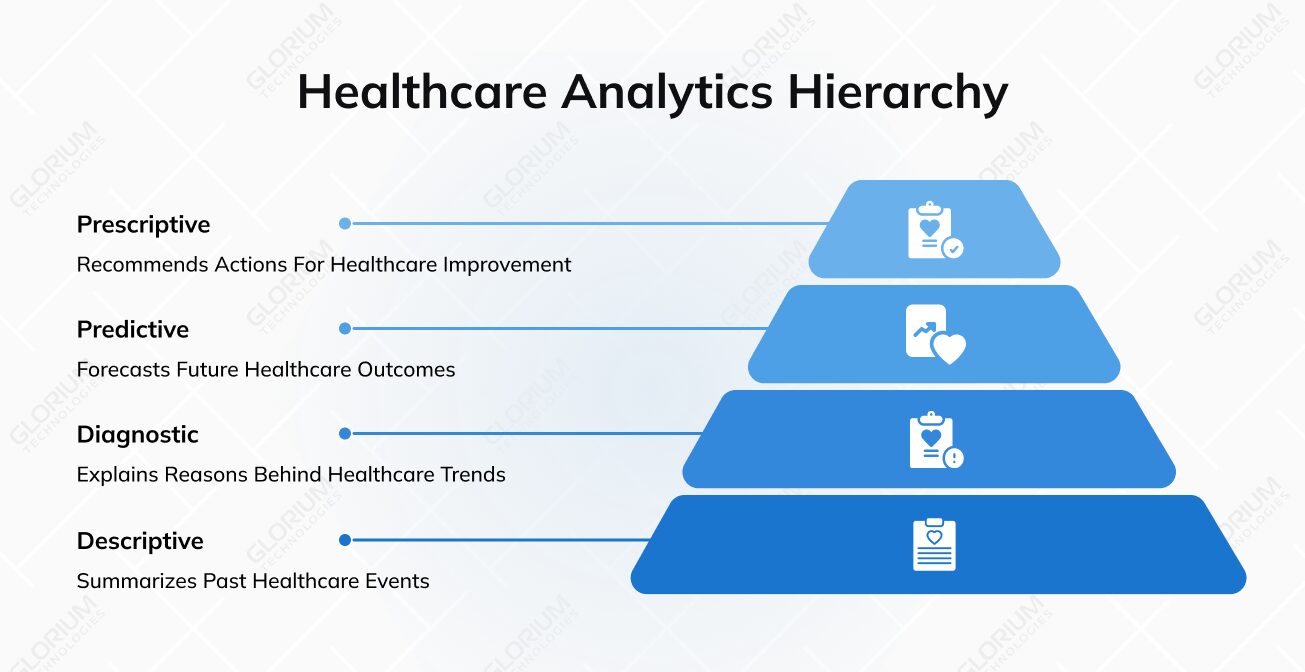
BI vendors sort healthcare analytics into four levels, and knowing which one a request belongs to sets expectations about effort:
Descriptive and diagnostic reporting usually lands within a business intelligence program’s first year. Predictive and prescriptive layers depend on data volume, labeling quality, and governance maturity, which is why organizations that skip straight to predictive modeling end up rebuilding the foundation afterward.
Healthcare organizations that get value early pick two or three use cases and finish them. Two completed dashboards with named owners build more credibility than twelve launched at once.
Clinical performance analytics
Clinical dashboards surface variation that averages hide. When two surgeons performing the same procedure show different complication rates, the data starts a conversation about technique, patient mix, or documentation.
Some healthcare BI tools push scores back into the workflow. Continuous monitoring of vitals and lab trends can flag high-risk patients before deterioration becomes obvious, at which point BI shifts into clinical decision support. Clinical outcomes improve when that signal reaches the bedside during the shift it applies to. A quality report published next month arrives too late to change anything.
Bed availability, discharge timing, and staffing are where most hospitals lose money quietly. Interactive dashboards that show census by unit against scheduled staff let managers rebalance before overtime accrues. Managers see the gaps hourly rather than monthly, so utilization stops depending on whoever watches the whiteboard, and resource allocation shifts from instinct to evidence.
The mechanics matter more than the chart. A useful operational view joins the ADT feed for live census, the scheduling system for planned staff, and the OR system for case start times, refreshed every fifteen to sixty minutes rather than overnight. That cadence is what turns discharge-barrier tracking into an intervention: a delayed transport order flagged at 10 a.m. still frees the bed that day, while the same flag in a monthly report only explains the length-of-stay number after the fact.
Revenue cycle management is often the fastest payback for healthcare BI software. Denial patterns by payer, coder, and procedure are visible in aggregate but invisible case by case. Once a dashboard groups denials by root cause, the fixes tend to be procedural and cheap, and financial performance improves without touching patient care.
Financial data also needs to sit next to clinical data. Cost per case only means something when you can see the patient outcomes that came with it, which is why financial performance dashboards belong on the same platform as quality reporting.
A U.S. home medical equipment provider came to us with exactly that problem: managers waiting on monthly exports to see how the business was running. Glorium Technologies delivered a cloud-based reporting layer covering financials, inventory, tasks, and patients in one platform, with HIPAA-compliant access controls built in.
BI supports population health by grouping patients into cohorts and tracking care gaps across them. Health systems taking on risk contracts need this view to know whether they are earning shared savings or funding them. Outreach teams work from a ranked list of patients rather than a broad care-improvement goal.
Cohort logic is where the engineering sits. Patients have to be attributed to a provider or a contract, stratified by a risk model such as HCC or ACG, then matched against measure specifications like HEDIS to find who is overdue for an A1c test, a mammogram, or a medication reconciliation. The output that changes behavior is a work list ordered by risk and by how closeable each gap is, delivered to care management weekly, with completed outreach written back so the same patient does not surface twice.
Quality measure reporting consumes analyst time that business intelligence can reclaim. Automating extraction and validation shortens submission cycles and leaves an audit trail regulators accept. Health information management teams recover the days they spent assembling submissions by hand.
The reclaimed time comes from a specific place. eCQM and MIPS submissions normally mean pulling numerator and denominator populations out of the EHR, checking exclusions by hand, and reconciling counts against the registry before the deadline. A BI layer that holds those measure definitions in the semantic model runs the same logic continuously, so gaps appear in October rather than during the submission window, and every figure carries lineage back to the source record when an auditor asks.
Academic medical centers, research organizations, and pharmaceutical companies apply BI to clinical trial data, a different dataset from the care-delivery metrics most hospitals report on. The questions change: enrollment velocity by site, protocol adherence, safety signals, and query resolution time.
Clinical research teams gain most from consolidating multi-site clinical trial data into one view. Underperforming sites become visible in weeks, well before the interim analysis, and protocol deviations surface before they threaten study integrity.
Payers and providers both use BI to spot billing anomalies that manual review misses. Peer-group benchmarking does most of the work here, comparing procedure frequency per 1,000 encounters against similar providers and flagging the outliers for review. The same pattern-matching applies to inventory: consumption measured against scheduled procedures flags stockouts and overstock early.
The return on healthcare business intelligence shows up in three places: clinical quality, operating margin, and the hours spent assembling spreadsheets before anyone can interpret them. The last one is usually the first to change.
Clinicians need the version of the data that arrives in time to matter. When risk scores, protocol compliance, and patient outcomes appear inside a familiar interface, decisions rest on evidence instead of recollection.
Improving patient outcomes follows from consistency more than from insight. BI tools make variation visible, and visible variation is the first step toward standardizing the patient care pathways that already work.
The published evidence is stronger for some of these outcomes than for others. A 2025 systematic review in JAMIA Open examined 70 studies of hospital dashboards and found length of stay fell in 28 of 43 reported findings, with costs reduced in 29 of 34 findings that measured economic impact. Mortality barely moved: 15 of 20 findings recorded no measurable change. Dashboards reliably shift throughput and cost, so a program measured on mortality alone will look like a failure even when it is working.
The operational gains stack up in ways finance can audit:
“A lot of the impact has been felt on the operational side of healthcare — particularly financial performance, revenue cycle, supply chain, kind of the blocking and tackling. But in my view, the soul of healthcare always resides in the clinical space… the magnitude of impact is quickly changing from operational efficiency to how do we drive clinical outcomes.”
Kevin Espenshide, TuneIn podcast
The underrated benefit shows up in meetings. When the CFO, the CMO, and the service line director open the same dashboard and see the same figure, leadership meetings shift from reconciling numbers to deciding what to do. Healthcare organizations describe that moment as when business intelligence stopped being an IT project.
Healthcare business intelligence projects rarely stall over the visualization layer. In a HIMSS survey of 100 US healthcare leaders involved in analytics platform decisions, 48% named competing priorities as the main barrier to data analytics adoption, 37% pointed to integration complexity, and 36% cited a shortage of internal resources.
Health systems accumulate applications the way houses accumulate boxes. A mid-sized health system may run separate platforms for the ED, oncology, home health, and billing, several of them predating the current leadership team. Systems that grew through acquisition often carry two of everything, and joining them costs more schedule time than anyone budgets for.
Integration with legacy systems takes longer than teams expect. Some expose modern APIs, some export flat files overnight, and some need a bespoke connector. Budgeting for that discovery up front prevents the schedule slip that kills momentum, and our legacy modernization services exist largely because the step gets underestimated.
Poor data quality carries clinical and reporting risks. Duplicate patient records, mismatched coding standards, and free-text fields that should have been structured degrade the dashboard’s usefulness. Healthcare data quality is the ceiling on everything built above it.
Unstructured data such as clinical notes holds real value, though extracting it reliably requires natural language processing and machine learning, which sits outside the reporting layer and needs separate engineering.
Fixing data quality is procedural work: automated validation rules at ingestion, lineage tracking so a wrong number can be traced to its source, and a named owner for each critical field.
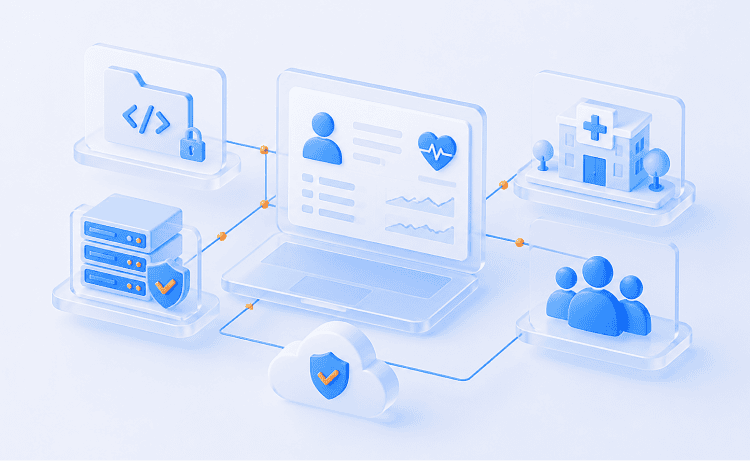
Healthcare business intelligence must comply with HIPAA and, where European patient data is involved, GDPR. Practically, that means role-based access control at the row and column level, encryption in transit and at rest, full audit logging, and de-identification for research use.
Teams often bolt security on after the dashboards work. Retrofitting access rules across dozens of reports costs far more than designing them in.
Clinicians ignore dashboards that take three clicks to reach, or that contradict what they already believe. Training staff in data literacy matters, and so does designing for the ten seconds of attention a charge nurse can spare between rounds. BI tools compete with patient care for attention and usually lose.
A phased business intelligence rollout beats a platform-wide launch in almost every health system we have worked with. The sequence below reflects how successful healthcare BI adoption tends to unfold across the healthcare industry.
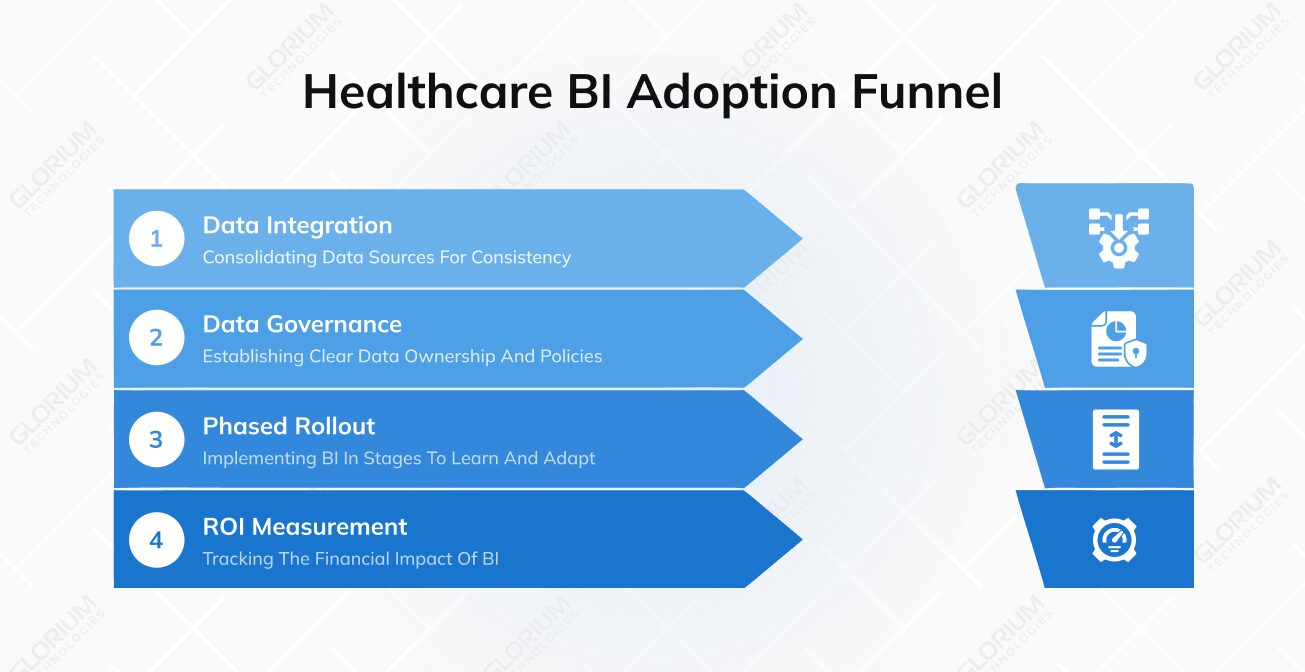
Write down the decisions the organization wants to make differently. Reducing readmissions on a specific service line is a decision, with an owner, a target, and a deadline. Broad goals such as visibility into patient data leave all three undefined. Each decision implies its metrics, refresh frequency, and audience. Alignment with clinical and business objectives turns a reporting backlog into a business intelligence program.
Data integration tools consolidate sources into a warehouse or lakehouse where identifiers and code sets are reconciled once. Building this layer first means every later dashboard inherits the same definitions. Data analytics teams stop re-litigating which patient records to count, and every new request starts from one base.
HL7 and FHIR integration has become the practical baseline for moving clinical data between systems, and most modern EHR software exposes FHIR APIs that a BI pipeline can consume.
That integration layer is what every later analytics depends on. Glorium Technologies built one for Astarte Medical, a precision nutrition company working with preterm infants. The application integrates with Epic, logs feeding protocol compliance, charts performance metrics, and produces a rounding report for clinical teams. Proprietary feeding, microbiome, and clinical datasets feed a decision tree that suggests nutrition plans from prior cases.
Data governance frameworks define who owns each metric, how disputes get resolved, and how often definitions are reviewed. Without that, two dashboards eventually show two readmission rates and trust evaporates.
Business intelligence governance now extends to models as well. Federal data shows that among hospitals using predictive AI in 2024, 82% evaluated models for accuracy and 74% for bias, with 79% conducting post-implementation monitoring.
Launch with one department, learn, then extend the rollout. Measuring ROI keeps the program funded: track analyst hours saved, denial recovery, avoided agency staffing, and length-of-stay changes against the baseline captured before launch.
Platform licensing is usually the smallest line in a healthcare BI budget. The items that decide the real number are:
In the builds we have scoped, implementation and first-year support run several times the software subscription. Budgets built around licensing alone run short at the integration stage, the part of the project that produces the value.
Healthcare BI software looks like a single product to end users and like four distinct layers to the teams maintaining it. Understanding the split helps when you evaluate vendors, since most sell strongly on one layer and outsource the rest.
Data integration tools consolidate feeds from EHRs, financial systems, and health information systems into a warehouse or lakehouse. This layer handles scheduling, error handling, and the reconciliation logic that maps five spellings of one department to a single identifier. Data processing at this stage is unglamorous, and getting it right consumes roughly half the effort on a healthcare BI project.
Between storage and the screen sits the semantic layer, where “readmission” acquires a definition the whole organization signs off on. Metrics defined here propagate everywhere, so governance and engineering must agree before the first chart.
Data visualization is the part everyone evaluates, and modern BI software differs less here than the demos suggest. Delivery matters more: whether reports reach clinicians inside the EHR, arrive by email at 6 a.m., or trigger an alert when a threshold is breached. Healthcare BI tools win or lose adoption at the delivery layer.
Predictive modeling, data mining, and machine learning sit alongside the reporting layer and draw on the same warehouse. Shared infrastructure keeps a data science team from producing insights the operational reports cannot reproduce.
This layer needs three things the reporting stack does not: a feature store so model inputs match the definitions in the semantic layer, a training environment stocked with de-identified history, and a monitoring job that watches for drift once the model is live. Skipping the third is the common failure. A readmission model trained before a service line reorganized keeps scoring confidently against a population that no longer exists, and the dashboard gives no hint that anything changed.
The general-purpose BI platforms most health systems license were not designed for healthcare specifically. Each becomes a healthcare BI tool through the integration and governance work layered around it, which is why the data layer determines the outcome more than the platform choice does.
That said, licensing shapes the budget for years. The figures below are vendor list prices as of mid-2026, taken from published pricing pages, such as Microsoft’s for Power BI. Confirm current rates with each vendor before budgeting, as several have recently changed their models.
| Platform | Pricing signal | Where it fits in healthcare | Watch for |
| Microsoft Power BI | Pro from roughly $14 per user/month; Premium Per User around $24; Fabric capacity from about $263/month | Organizations already on Microsoft 365 and Azure, with the lowest per-seat entry cost | DAX learning curve; Azure services billed separately from the license |
| Tableau | Creator around $75 per user/month, with lower Viewer and Explorer tiers | Teams where data visualization quality is the deliverable, such as executive and board reporting | Role-based licensing multiplies quickly across a large viewer population |
| Qlik Cloud Analytics | Capacity-based for new customers, from roughly $300/month for 10 GB | Ad hoc exploration across large, associative datasets | Priced on data volume rather than seats, so a single large fact table can shift the tier |
| Looker | No published list price; typically several thousand dollars per month minimum | Organizations standardizing metric definitions in code through LookML | Modeling overhead is real engineering work, not configuration |
| ThoughtSpot | From roughly $25 per user/month | Clinicians and managers who want natural language querying alongside standard data visualization | Live-query models push compute cost onto your warehouse bill |
Two things matter more than the feature grid. First, HIPAA eligibility: cloud BI platforms can hold protected health information, but only under a signed business associate agreement with correctly configured encryption, role-based access control, and audit logging. Second, embedding: if clinicians need insight inside the EHR, embedded analytics moves to the top of the requirements list.
The platforms in the table arrive with no clinical vocabulary. A second group ships with one already built, along with measure libraries, claims models, and patient matching. Most health systems license something from this list alongside a general-purpose BI tool rather than picking one camp:
Licensing any platform on this list still leaves the integration work ahead of you. Identifiers have to be reconciled, measure definitions agreed on, and source systems connected before the shipped content means anything against your own data, which is why the evaluation question worth asking a vendor is how much of that work their implementation actually covers.
Two forces are reshaping healthcare business intelligence platforms: artificial intelligence moving from pilot to production, and cloud economics making advanced analytics affordable well beyond academic medical centers. Both change what the healthcare industry expects from a reporting stack.
Predictive analytics has moved into everyday reporting. Machine learning models now forecast patient volume, model financial risk, and rank patients by likelihood of readmission, with results delivered through the same dashboards leaders already open. Machine learning now ships as a packaged feature rather than a separate data science project, with automated model training and scoring endpoints exposed inside the reporting platform.
A federal data brief on hospital use of predictive AI reports that 71% of hospitals used predictive AI integrated with their EHR in 2024, up from 66% the year before, with billing simplification and scheduling among the fastest-growing applications.
Analyst queues are the bottleneck in most health systems. Self-service business intelligence software lets department leaders build their own views inside guardrails set by the governance team. Those guardrails are concrete: row-level security tied to the user’s role, and certified datasets that carry approved metric definitions so a self-built report cannot quietly invent its own. Natural language querying is lowering the skill floor further, so healthcare organizations get faster answers without adding headcount.
Cloud data platforms absorb the data volume health systems produce, with no capital spending on hardware. Deloitte’s survey of health system executives found around 90% expect the use of digital technologies to accelerate, with 60% prioritizing investment in core systems such as EMRs and ERP.
FHIR-enabled integration is what makes those investments compound. Each new data source becomes cheaper to connect than the last.
Across these shifts, the differentiator stays constant: the quality of the data layer underneath. Health systems that invested in integration and governance early add predictive features in weeks, while those still reconciling spreadsheets face the same work later and under more pressure.
Engineering choices made in the first three months usually determine whether a healthcare business intelligence program succeeds, long before anyone opens a dashboard.
No two health systems have the same data landscape, so no two healthcare BI builds look alike. The sequence stays constant: understand the decisions, map the sources, reconcile the identifiers, then build the reporting layer people will open. Nearly all of that happens before a single chart is drawn, which is where an experienced partner saves the most time.
Glorium Technologies has been building software since 2010, with healthcare as a core specialization. That practice covers custom healthcare software development for the systems the data comes from, big data and analytics for the warehouse and pipelines under a BI program, data science consulting once those numbers are trustworthy enough to model on, and machine learning services when the history is deep enough to train against. Sixteen years in the healthcare industry means our engineers come to the first workshop already fluent in HL7 feeds and payer rules.
HIPAA-compliant architecture, role-based access control, and audit logging go into the design from the first sprint. Some clients hand us a defined BI project with fixed scope; others extend their team with dedicated developers and data engineers.
Tell us the decision you want to improve first, and we will map the data behind it. Contact us to start with a conversation about your systems.
For a single, well-scoped use case with cooperative source systems, six to twelve weeks is realistic from kickoff to a dashboard clinicians use. Integration discovery drives the variance: heavy data quality work or a custom connector extends that first cycle, and later ones move faster. Glorium Technologies scopes discovery before quoting a timeline, so the estimate reflects your source systems instead of an industry average.
Most healthcare organizations do both. Commercial business intelligence software handles visualization and self-service well, while the integration and semantic layer underneath needs custom engineering, because the source systems differ at every organization. Buying the front end and building the pipeline keeps BI software licensing costs predictable. Glorium Technologies typically builds the pipeline and semantic layer against whichever platform a client has already licensed.
Dashboards that only report historical performance generally do not. Once a tool scores patients or recommends action, you are closer to clinical decision support, which carries validation, monitoring, and sometimes regulatory obligations. Which side of the line a project sits on belongs in discovery, and Glorium Technologies raises it there, before the build.
Assign an owner and a review date to every dashboard when you publish it. Usage data helps: if a report has not been opened in ninety days, fix it or retire it. Definitions drift as service lines reorganize, so a quarterly review of metric logic prevents decay. Glorium Technologies builds that cycle into support engagements.
Yes, though the path differs. Modern systems connect through FHIR or REST APIs. Older platforms may need database-level extraction, scheduled file drops, or middleware, which adds engineering time that belongs in the estimate. Glorium Technologies handles that connector work as part of legacy modernization.